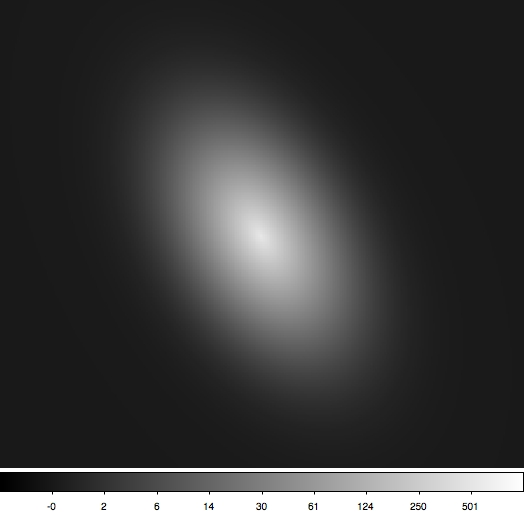
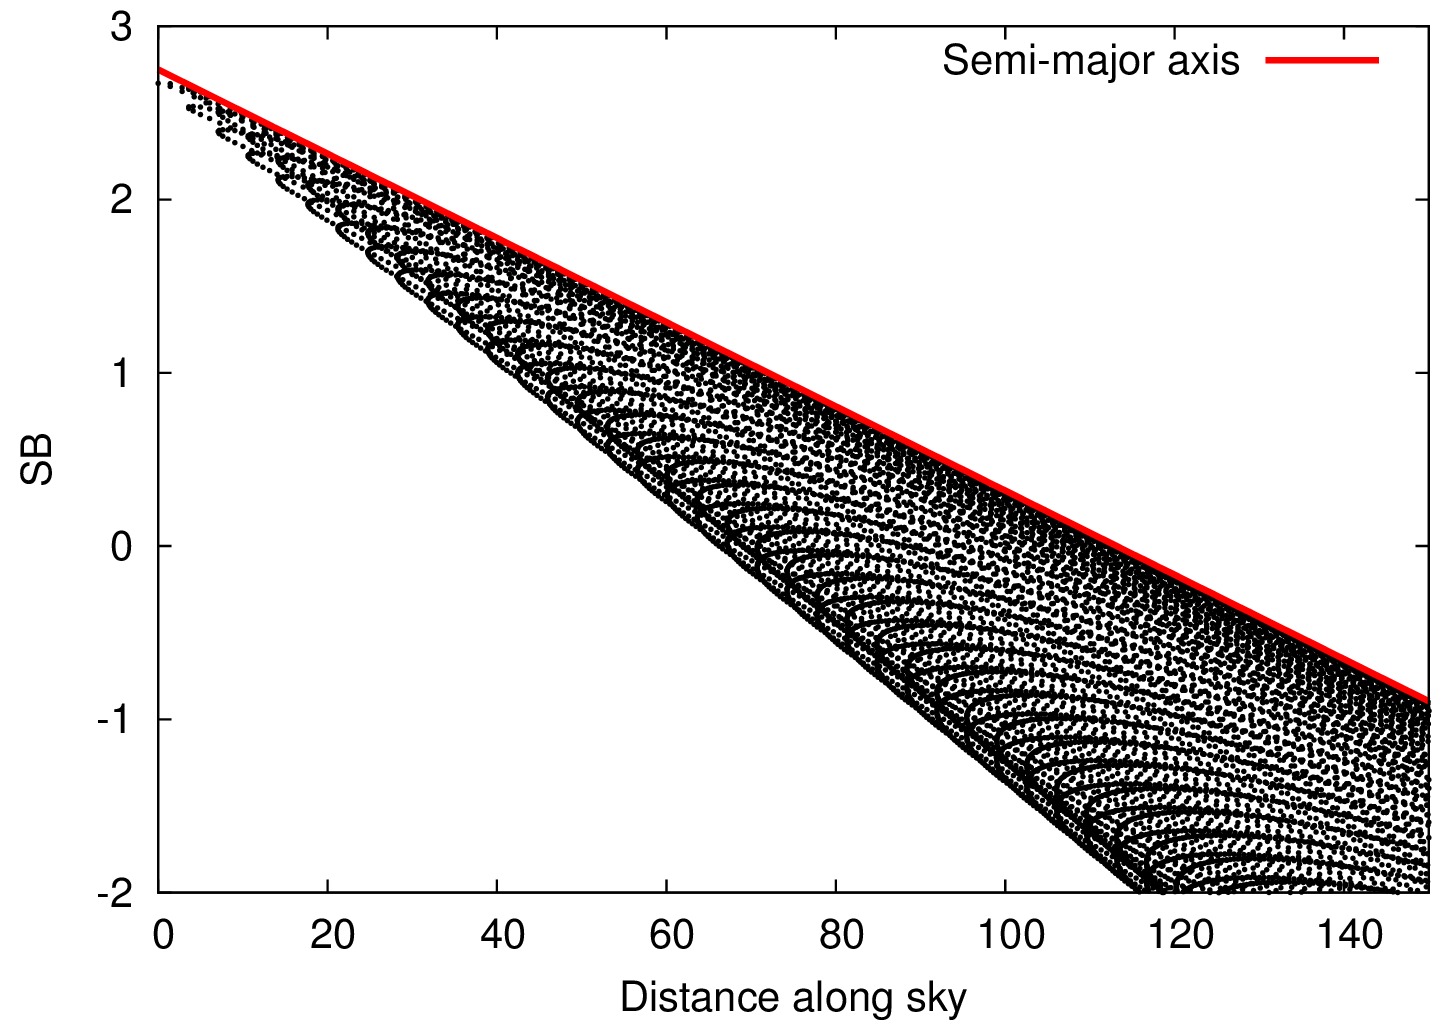
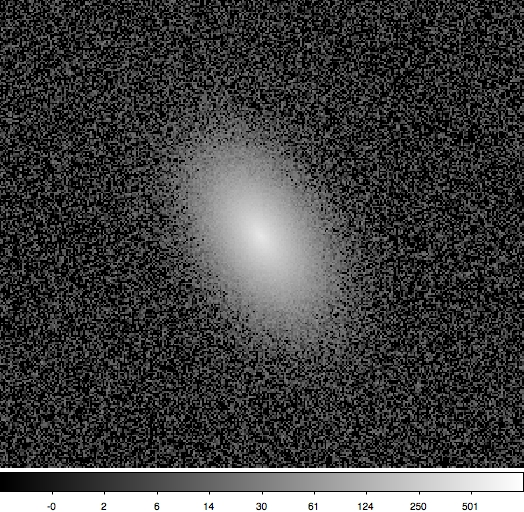
| This row shows an artifical image of a galaxy with an exponential profile. The azimuthally averaged profile is shown with the red line in the right panel. Plotting all pixel values
leads to the wedge-shaped distribution of the black points. This is what we call two-dimensional profile and contains more information. In the following we elaborate the use of this profile representation.
|  |  |
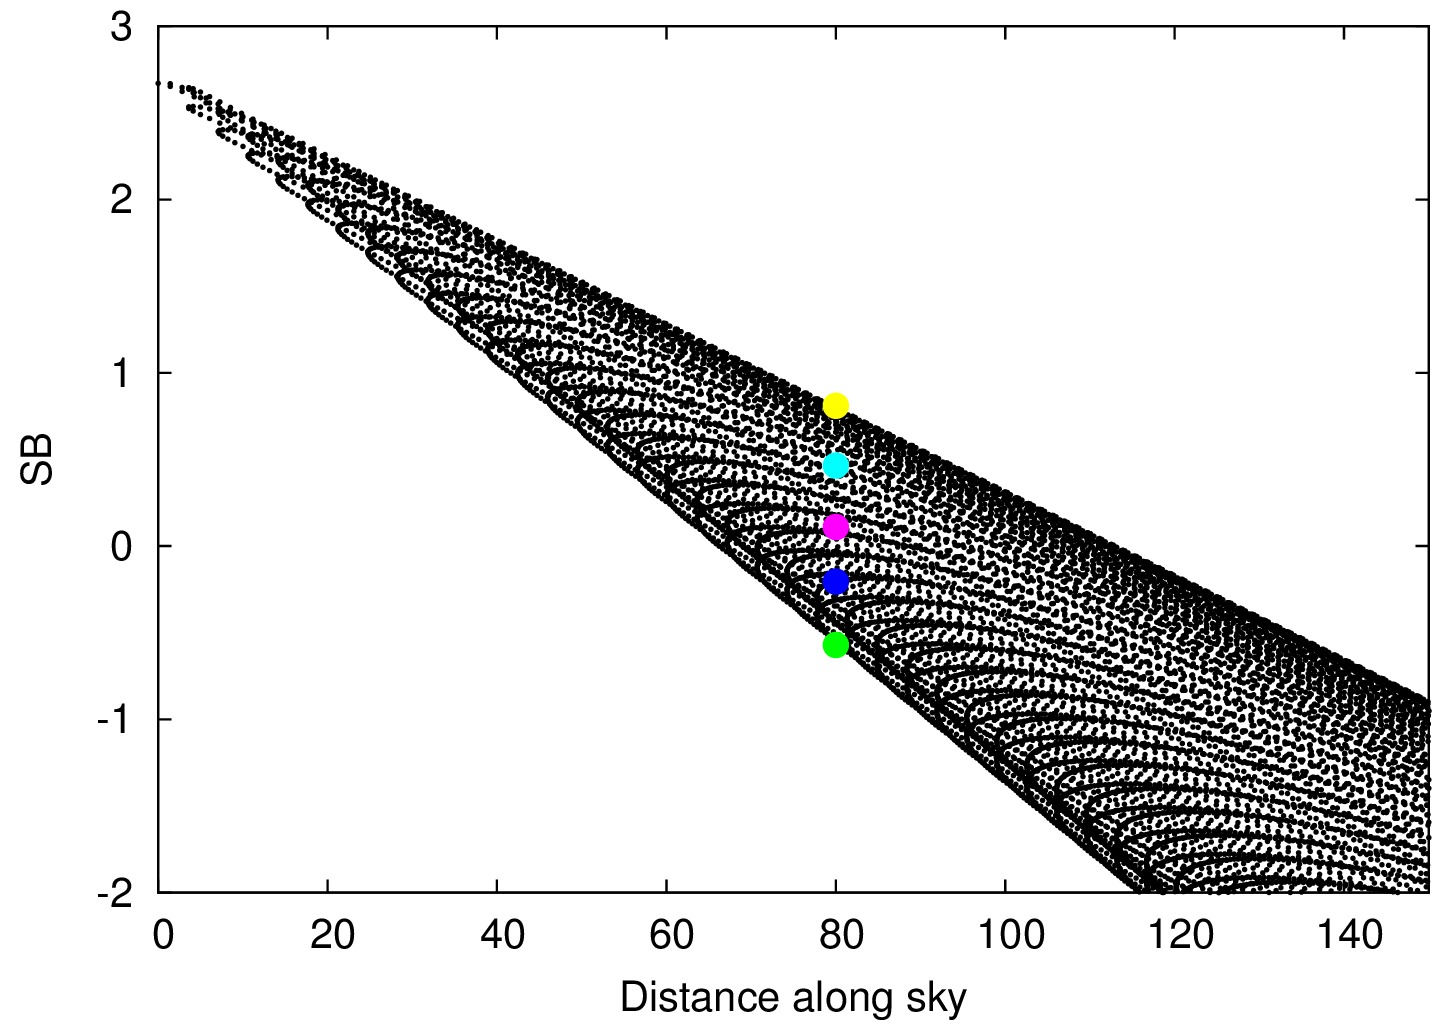
| The artifical image now contains noise in order to resemble more the observation. Some confusion can be caused by the fact that pixels along an isophote of the galaxy are not joined to a single point in the profile, but they lay on a horizontal line in the plot. While it is obvious that points with the same surface brightness can be found on horizontal lines in the plot, the mapping of pixels on an isophote to horizontal lines in the plot may be counterintuitive. The distances between the inner- and outermost point at a given surface brightness is given by the axis ratio of the isophote. Therefore, the axis ratio determines the opening angle of the wedge.
| 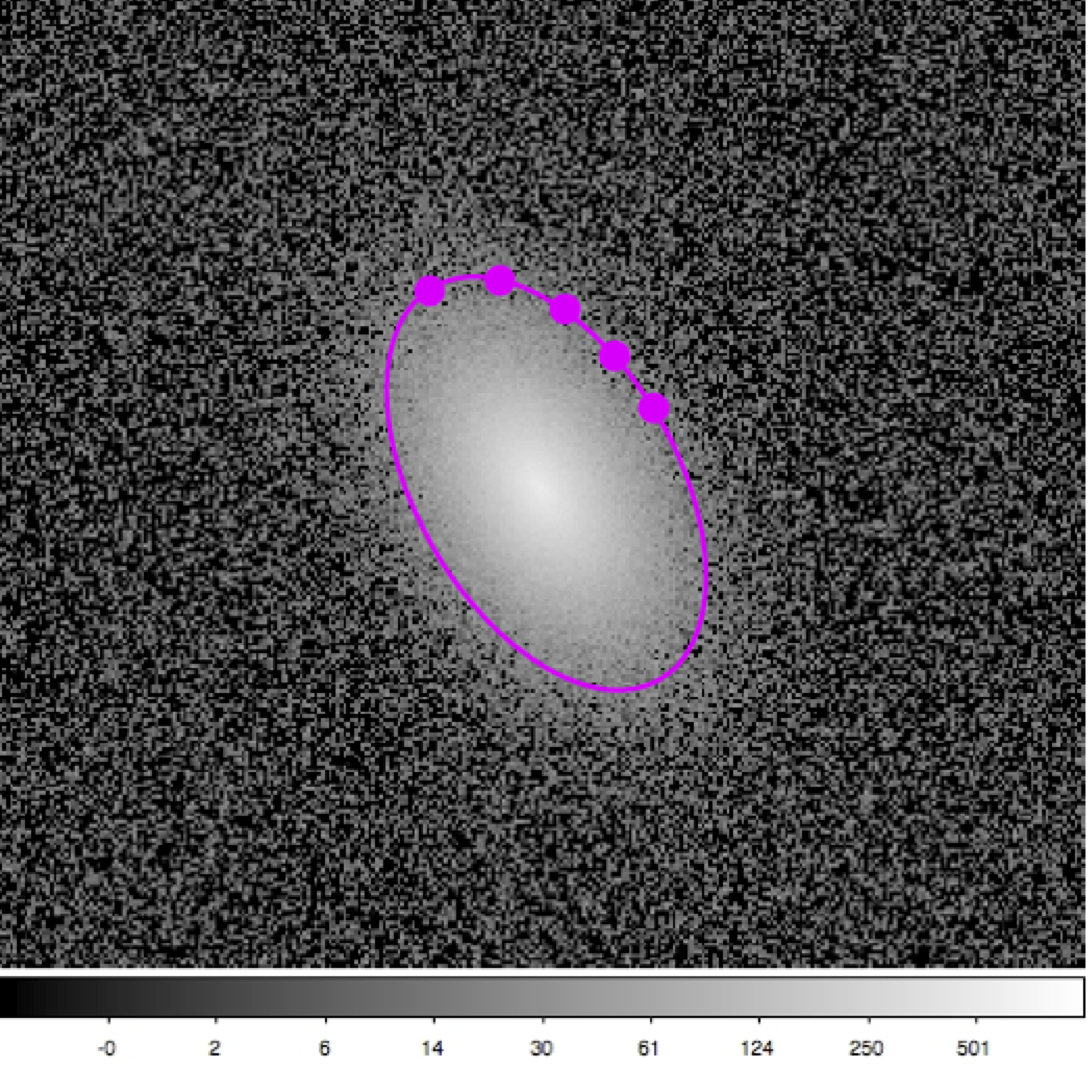 | 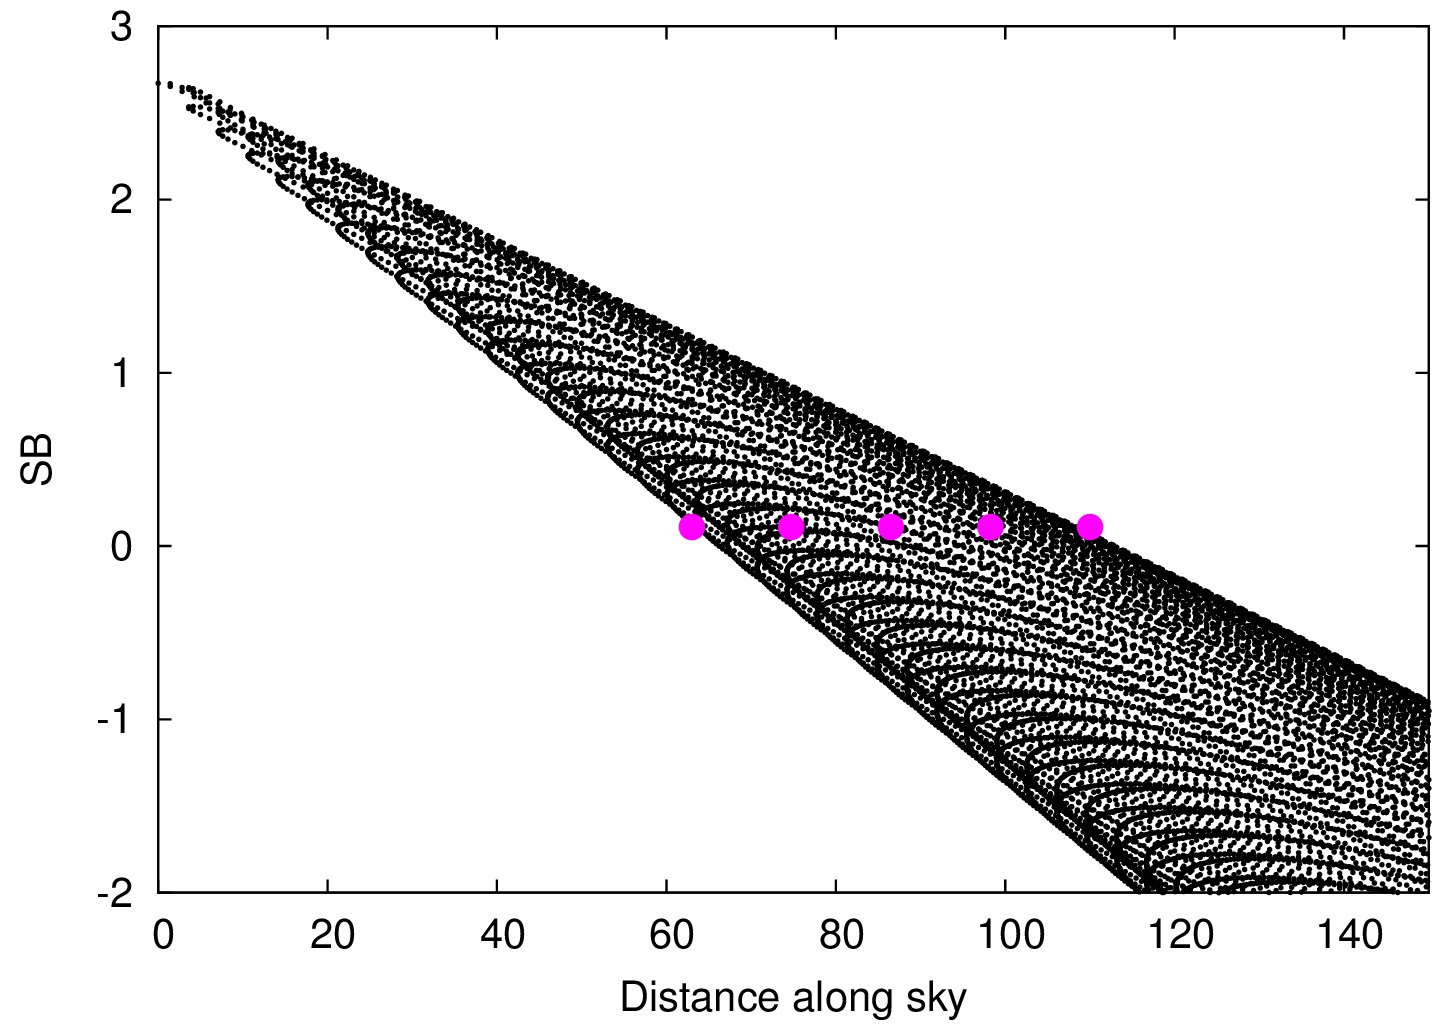 |
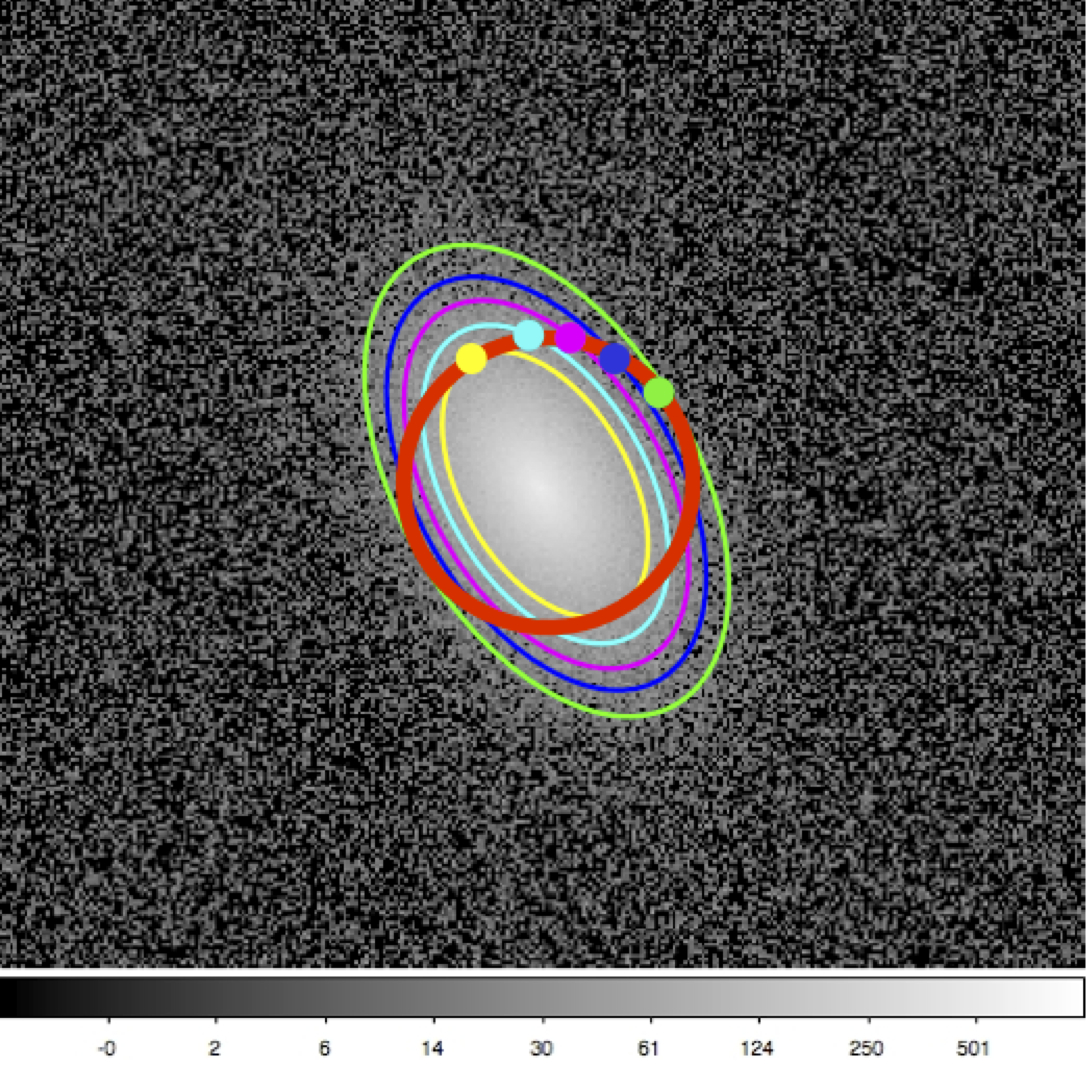
| When considering points at a certain value on the x-axis, this translates to an identical angular distance to the galaxy center on the sky, i.e. a circle.
Depending on the axis ratio of the galaxy or component this circle will cross different numbers of isophotes. This is another way of viewing the apparent flatting of the light distribution.
|  |  |
| This row shows the direct comparison of the two-dimensional profile of the model used to construct the artificial image, and the two-dimensional profile obtained from the actual artifical image.
The strong apparent mismatch is caused by plotting the noisy pixels on a logarithmic scale.
|  | 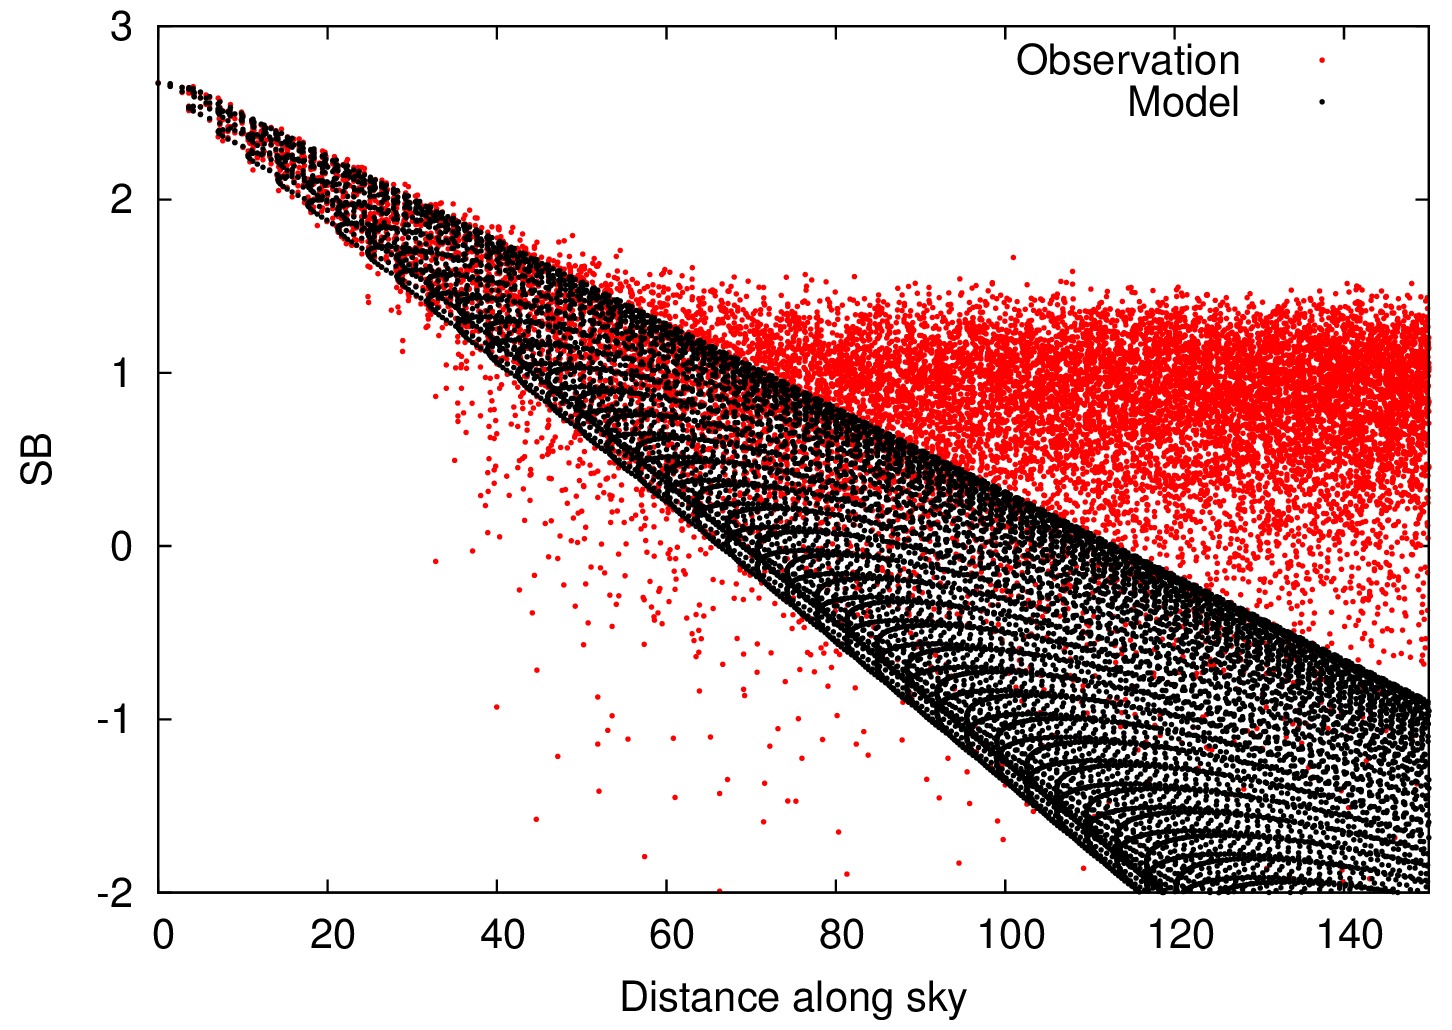 |
| When the noise is also added to the model, the apparent problem is resolved. This is the reason why we plot the model in the two-dimensional profiles twice: the pure model as well as the model including noise corresponding to the noise in the observation. | | 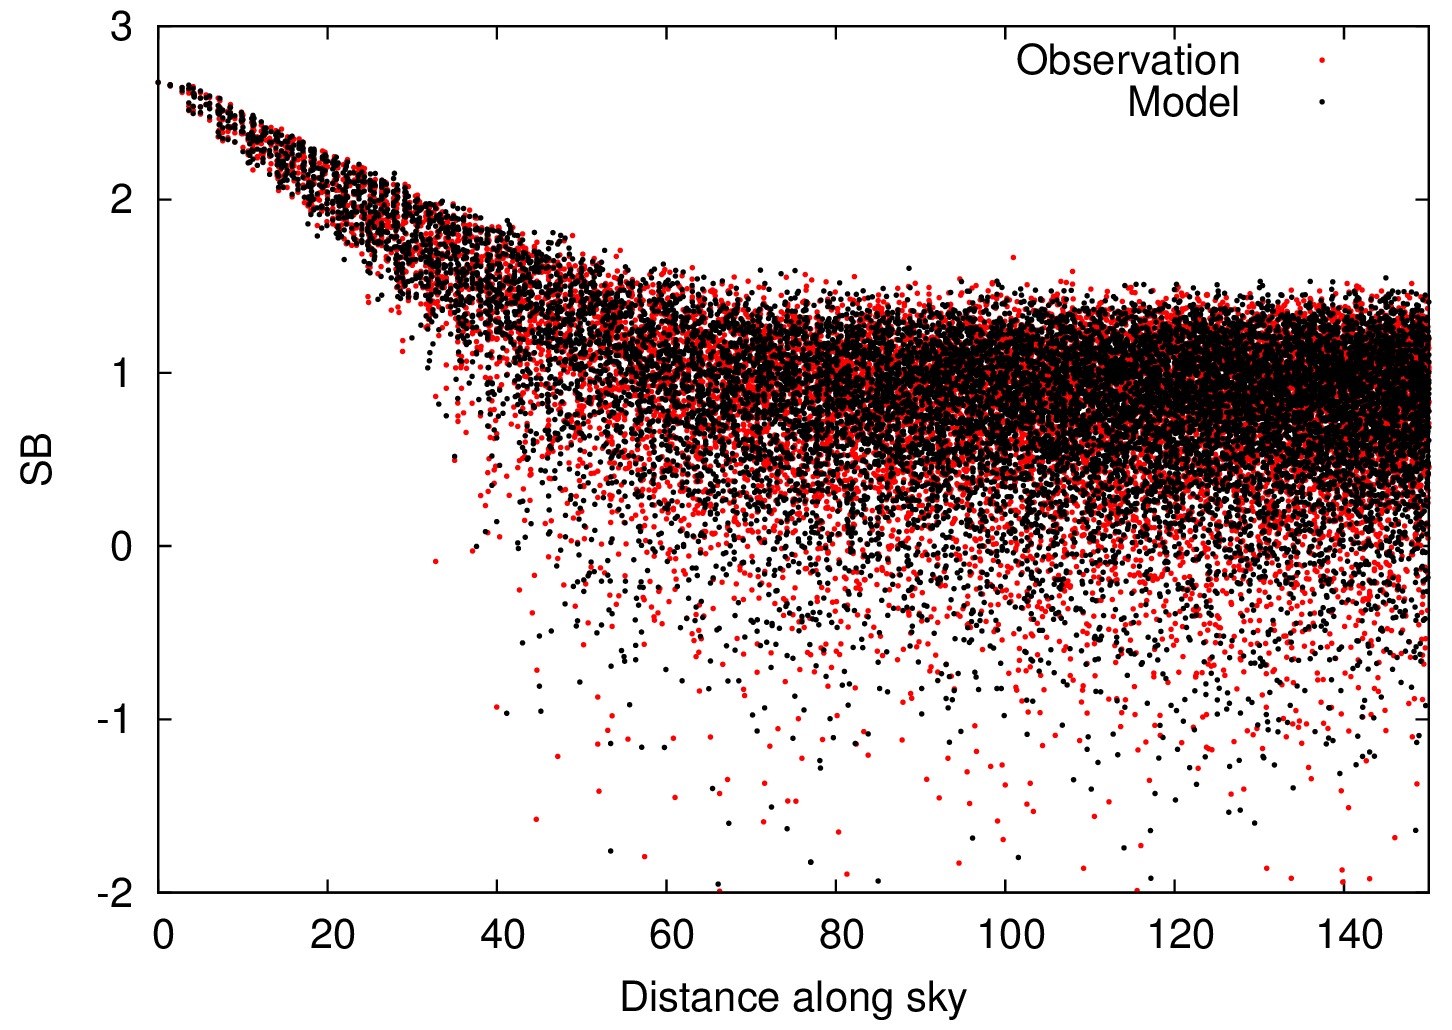 |