The NIRS0S ProjectWhat is NIRS0SThe Near-InfraRed S0 Survey (NIRS0S) has been an attempt to obtain a statistically well-defined database of deep images for nearly 200 S0 galaxies, both in the near-infrared and in the optical. The project was initiated in 2003 at the Nordic Optical telescope (NOT) in La Palma, as a collaboration between the Universities of Alabama (Ronald Buta) and Oulu (Eija Laurikainen, Heikki Salo). Soon after that Johan Knapen (IAC) also joined the team. The project has obtained significant observing time from the New Technology Telescope (NTT), operated at the European Southern Observatory (ESO) in Chile, as well as from the William Herschel Telescope (WHT) and the Italian Telescopio Nazionale Galileo (TNG), both operated at the island of La Palma. Observing time was obtained also from the Cerro Tololo Inter-American Observatory (CTIO) in La Serena, Chile, and from Flamingos (FLMN) operated at KPNO in Tucson, Arizona. The observations were completed in 2009. The $K_s$-band images are deep, being typically 2-3 magnitudes deeper than the 2 Micron All Sky Survey (2MASS) images. The infrared images and the detailed new galaxy classifications for NIRS0S have been published in 'the Near-IR Atlas of S0-S0/a galaxies (NIRS0S)' by Laurikainen et al. (2011). The most important results, published in several papers, are discussed in the review by Laurikainen et al. (2012). Interesting results have been obtained, which can be compared with the galaxy properties at higher redshifts. Analysis methods
The main analysis use Fourier methods (Salo et al. 1999, 2010; see also Laurikainen & Salo 2002) for calculating the properties of bars, and 2D multi-component structural analysis for decomposing the 2D light distributions of the galaxies into bulges, disks, bars, ovals and lenses (see Laurikainen, Salo; Buta 2004, 2005). The codes used are written by Salo. The Fourier method consists of calculating bar strengths (Qg) by decomposing the surface brightness at each radius into azimuthal Fourier components. The gravitational potential is obtained by FFT over azimuth, combined with direct summation over radial and vertical coordinates. An important advantage of this Polar method is the suppression of spurious force maxima which may arise in the direct 3D Cartesian FFT integration in the noisy outer disks. When the project was started both approaches were new, e.g., similar methods were not applied for any significant sample of early-type galaxies. Near-IR view to the complex morphology of the S0sIn the NIRS0S Atlas (Laurikainen et al. 2011) we present the images and the detailed morphological classification of the galaxies in the near-IR. In addition to the normal de Vaucouleurs' type classification, our classification includes coding for boxy/x-shaped and ansae bar morphology. Also, inner (l) and outer (L) lenses as well as ringlenses (rl, RL) are coded, for the first time in a systematic manner for a large S0 galaxy sample. Examples of the bar morphologies are shown in Figure 1: the x-shaped structure in IC 5240 is remarkable and challenges the current explanations for the boxy/peanut bulges in barred galaxies, based on vertical thickening of the bar. An example of a non-barred lens galaxy, NGC 524, is shown in Figure 2, which galaxy in fact shows series of lenses. Currently there is no theoretical explanation for such lenses. We found also a new morphological feature, a barlens, which look like a normal lens, but is larger than the nuclear lens, and appears always inside a prominent bar. Most probably it forms part of the bar itself.

Multi-component decompositions
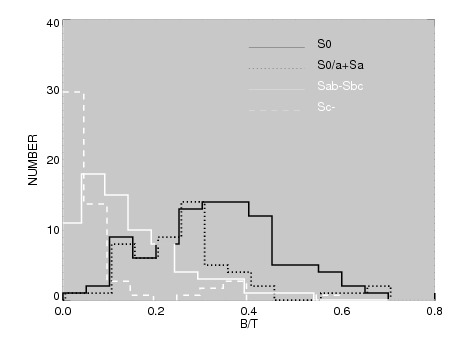
We have applied 2D multi-component decomposition approach for the NIRS0S (+ for a similarly sized sample of spirals). In addition to the fluxes of the bulges and disks, fluxes of bars and lenses were also fitted by analytical functions. For the S0s as a group this approach appeared to be of critical importance, because it showed that the S0s cover nearly the same range of bulge-to-total (B/T) flux-ratios as the bright spirals (Laurikainen et al. 2010; see Fig. 3). Generally the value of the S\'ersic index of the bulge is fairly small ($\sim$2), indicating that the S0s are not like elliptical galaxies. Also, it appeared that the properties of the disks (central surface brightness mu_0, scale length of the disk h_R) are similar in the S0s and spirals having similar brightnesses. While calculating the structural parameters special attention was payed for correcting the internal dust, based on recent dust estimates for the galaxies in the local Universe. One important implication of our study is that the S0s might form a similar sequence on sub-types as the spiral galaxies, S0a, S0b and S0c, depending on which are the progenitors of these galaxies (Laurikainen et al. 2010). Spirals can transform into S0s by loosing their gas in star formation and partly also in some stripping mechanisms. Such a scenario was first suggested by van den Bergh (1976), but at that time there was no observational evidence for that. A similar suggestion, from different points of view, has been made nearly simultaneously also by two other groups (Kormendy 2011; Cappellari et al. 2011). Another important implication of our decomposition approach is that the observed baryonic mass confined to galactic bulges (Laurikainen wt al. 2004, 2010) is much lower than predicted by the current cosmological models.
How robust are bars in the Universe?
Important guestions are when are bars formed, how robust they are, and what is their role in internal dynamical evolution of galaxies. It is only recently that it has possible to create bars in cosmological simulations (Scannapieco et al. 2011) that resemble the bars seen in the present day galaxies. How robust they are may depend on how much gas from the intergalactic medium is accreted to the galaxies. It has been suggested by Bournaud & Combes (2002) that bars are easily destroyed and that there are multiple episodes of bar formation. Bars form and evolve when they have gas, and the evolution stops when the gas is used in star formation. Therefore, if bar strength varies over time, the relative frequency of galaxies in each bar strength bin tells us the relative amount of time a galaxy spends in a certain bar state. Alternatively bars are fairly robust in which case a smaller fraction of strong bars is expected. We tested this using Qg as a measure of bar strength, which is the bar induced tangential force normalized to the mean axisymmetric force field. By comparing the observed Qg-distribution with the theoretical models we found evidence that bars in galaxies are actually fairly robust (Buta et al. 2004, 2005).
Bar induced secular evolution in galaxies
If bars indeed are robust in galaxies that would make easier to understand why bars are so common among the S0s. We found that S0^- types have bars as frequently as the early-type spirals, and only after that start dropping towards the earlier type systems (Laurikainen et al. 2009). It is theoretically predicted that bars evolve in dynamical interaction between the structure components, due to angular momentum transfer between the disk and the halo, which occurs in the resonances (Athanassoula 2003). Possible observational manifestation of such evolution is discussed in our papers. For example, the properties of bars evolve in the Hubble sequence: they grow in length and in Fourier density amplitude towards the earlier types, but decrease in strength in terms of Qg. This is yet not fully understood, because the bar pattern speed is expected to simultaneously slow down, which contradicts the estimates, based on the Tremaine-Weinberg method. In our forthcoming paper we also discuss the morphology of a bar and its connection to other structure components like bulges and lenses.
ReferencesAthanassoula 2003, MNRAS, 341, 1179 Bournaud et al. 2002, A&A, 394, L35 Buta et al. 2005, AJ, 130, 506 Cappellari M. et al. 2011, MNRAS, 416, 1680 Eskridge P. et al. 2002, ApJS, 143, 73 Kormendy J. 2012, ApJS, 198,2 Laurikainen et al. 2012, Advances in Astronomy, in press (astro-ph 1111.6447) Laurikainen et al. 2011, MNRAS, 418, 1452 Laurikainen et al. 2010, MNRAS, 405, 1089 Laurikainen, Salo, Buta 2004, ApJ, 607, 103 Laurikainen, Salo 2002, MNRAS, 337, 1233 Salo et al. 1999 AJ, 117, 792 Salo et al. 2010 ApJL, 715, 56 Scannapieco et al. 2011, MNRAS, 417, 154 van den Bergh 1976, ApJ, 206, 883
The NIRS0S PagesAll the content of these pages is property of the NIRS0S team. Any use should be referenced in a proper way. The data on the pages is updated regularly, but we advise the user to check the date of last modification. The NIRS0S pages are kept on two different locations. According to your own preferences, you may chose one of the following locations: NIRS0S @ University of Oulu, Finland
|

 |
 |
 |
 |
 |
 |
 |