Carbon footprint of the University of Oulu
Carbon Footprint of University of Oulu

Project information
Project duration
-
Project coordinator
University of Oulu
Unit and faculty
Researchers
Project description
As part of the strategy to push the development of sustainable campuses, the University of Oulu has decided to reduce its carbon footprint by 50% until 2025 compared to the level of 2019. To make this endeavour possible, the carbon footprint working group (CF WG) has been mandated to calculate the CF of the University of Oulu. As part of this work, several researches were initiated to calculate our carbon footprint and handprint, which include the following ones, among others:
- Review of CF methods
- CF of campus operations
- CF of laboratory and research equipment
- CF of ICT equipment and networks
- Carbon handprint of research at the University of Oulu
- Carbon Neutrality Roadmap
Contact person: Meeri Hilli [meeri.hilli@oulu.fi]
Research groups
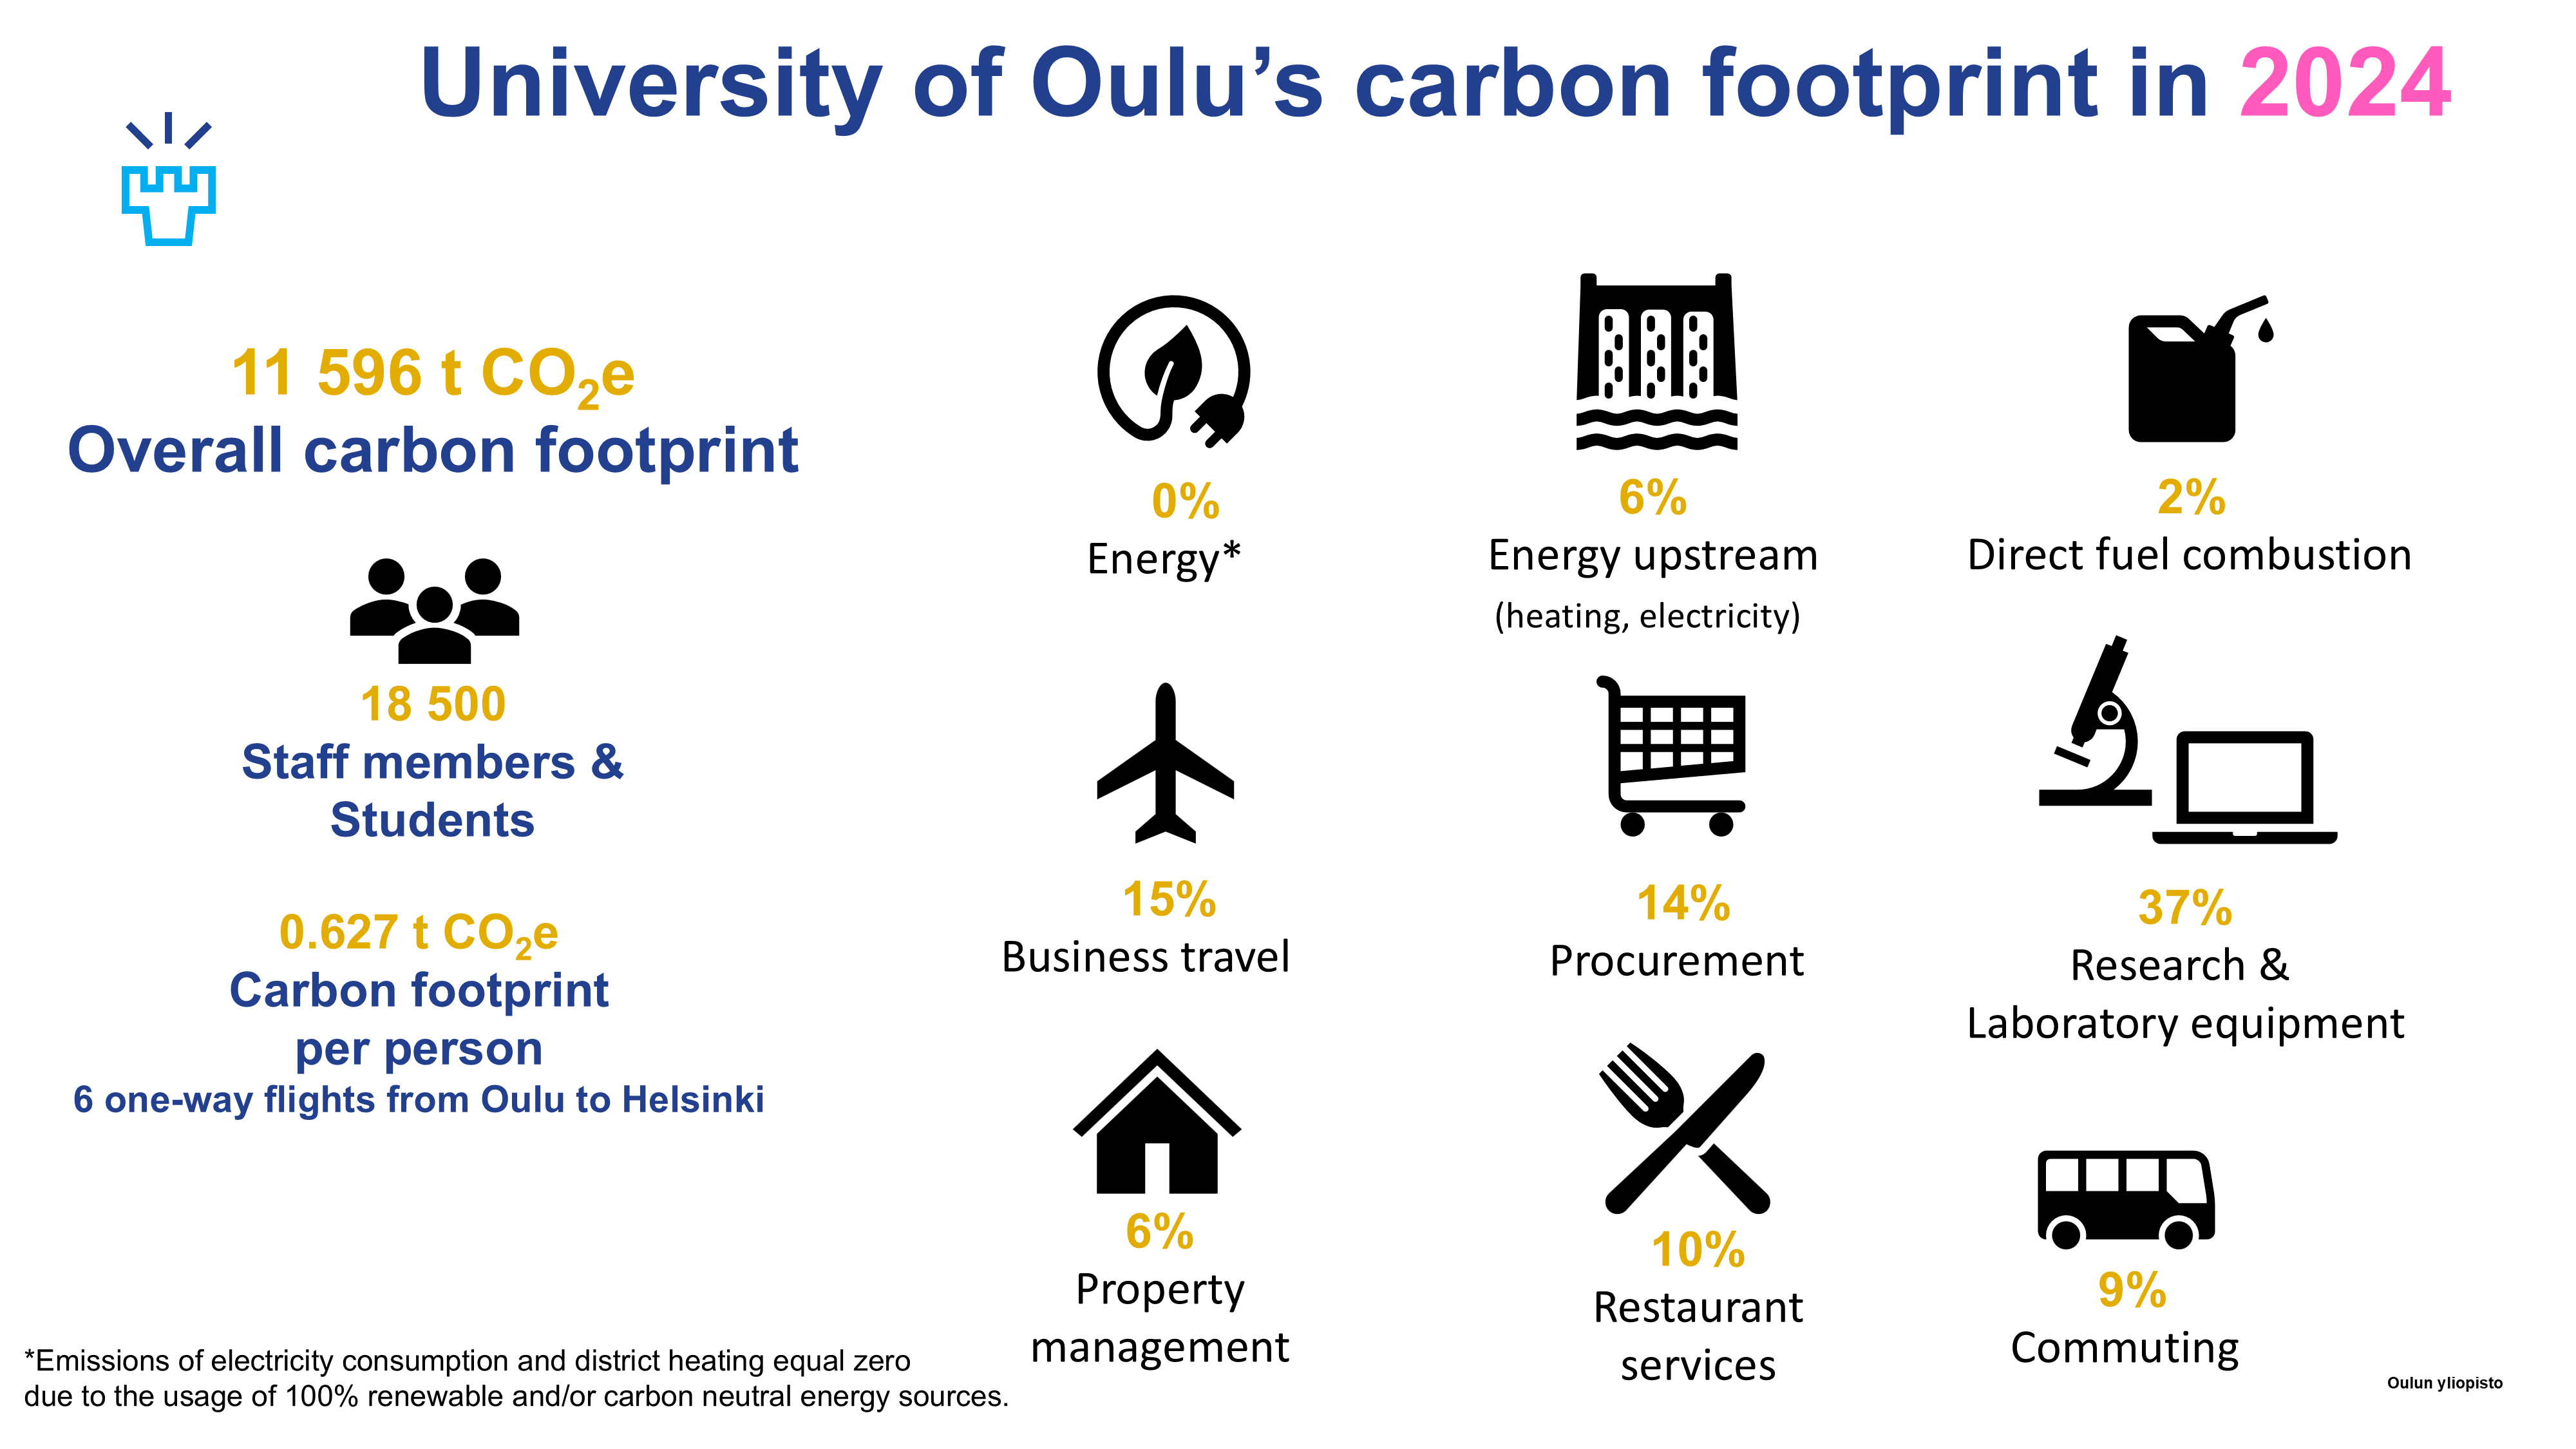
The most recent calculation was done for 2024 and the results have also been published in form of a data collection report (PDF). The overall carbon footprint was calculated as 11 596 t CO2e. This is about 627 kg CO2e per person, which accounts for about 6 one-way Oulu-Helsinki flights.
Emissions due to the purchased research and laboratory equipment contribute the biggest share with 37%, followed by the impact of other procurements accounting for 14% of the carbon footprint. Commuting, business travel and restaurant services account for 9%, 15% and 10%, respectively. Shares of restaurant services and research and laboratory equipment decreased for one percentage point, business travel increased for one percentage point compared to 2023. Shares of under 10% have been calculated for property management, direct fuel combustion and energy upstream emissions, related to district heating and electricity.
The calculation methods have been updated at 2022 (updated emission factors and improved allocation of emissions). From summer 2022 onward, the district heating procured for the University’s premises has been carbon neutral. In 2023 calculation the energy upstream emissions (heating) were included for the first time in scope 3. In 2024 calculation, both heating and electricity energy upstream emissions were included for the first time.
The University’s carbon footprint has so far been calculated for each year from 2018 onwards. While the results for 2019 are used as the base year, the following years are very important in terms of assessing the performance of mitigation measures.
Total emissions have decreased about 39 % during the six-year period. The largest drop occurred between 2019 and 2021, after which the total emissions have remained quite stable. The pandemic in years 2020–2021 explains the most part of the emission reductions. During that period, a clear decrease can be observed in the shares of business travel and restaurant service emissions. The share of business travel emissions started to increase in 2022 and now the level is almost the same as in year 2019.
The largest single emission reduction has resulted from the fact that the university’s facilities have switched to district heating produced with renewable energy sources, covered by guarantees of origin, which has significantly reduced the emission factor of district heating. This change is mostly calculative. However, the total district heating consumption of the university’s facilities has decreased by 31 % when comparing year 2019 (34,8 GWh) to year 2024 (24 GWh). The change is due to the university’s premises reductions, as well as energy efficiency measures conducted by the property owner Suomen Yliopistokiinteistöt Oy. Procurement emissions have increased significantly over the years and currently their share from the total emissions is the highest.

Even though it is not typically included in an organization's carbon footprint, we have decided to include also the impact of commuting of students and staff from home to the campus. The argument behind this decision is that a university’s purpose is research and education and, therefore, people, their awareness and knowledge level is central to our activities. Hence, the environmental impact caused by the individual members of the university community should be of importance. Given the large amount of comments received on the survey, university staff is clearly interested in improved their commuting habits. Read the report from the commuting survey (PDF) to find out more.
The Carbon Footprint Working Group has also been investigating the carbon handprint of our research and has been looking into the impacts of distance teaching when extending the boundaries of calculations beyond the campus. A master’s thesis on the handprint subject was published in 2021 (in Finnish).
The next steps in our research is the follow-up our CF as a continuous process, as well as defining reduction targets.
Based on the above results of the carbon footprint calculation, the procurement of research equipment and laboratory supply accounted for around 16% of the total amount of emissions allocated to the University in 2019. This share is, however, solely based on the investment costs and does not take the usage phase of the items into account. While the University is buying electricity generated by 100% renewable energies for all premises, resulting in zero emissions for the electricity consumption, it is still desirable to reduce the overall consumption of electricity. This could for example be achieved with more responsible handling of laboratory equipment. At the moment, only about half of the research infrastructure of the Linnanmaa campus has been inventoried. However, it has been noted that there is insufficient information on the energy consumption of laboratory devices and life-cycle environmental impacts. This will need to improve, as sustainable laboratory operations will help achieving the goal of carbon footprint reduction of the University of Oulu.
This work will continue, meanwhile, you can read the preliminary report on the Carbon Footprint of Research and Laboratory Equipment of the University of Oulu.

Utilisation of information and communication technologies is an integral part of a university. The University of Oulu currently leases or owns over 3000 laptops and more than 1000 workstations or desktop PCs , with additional screens, mouses and keyboards. Additionally, the University also offers mobile phones for work-related purposes to staff members. While the impact of the equipment related to the direct electricity consumption might be the most tangible part, the usage share is only one aspect that contributes to the life cycle carbon footprint of ICT equipment. In addition to the emissions related to the life cycle of IT equipment, an assessment was made also regarding the carbon footprint of data transmission and network usage. A carbon footprint calculation was done based on the assumptions for yearly working hours of staff members, the energy intensity of the data transmission network and data centres, as well as the electricity consumption of servers, wireless base station and other relevant telecommunication equipment.
Data regarding the CF of ICT equipment or Internet in particular are hard to com by, and many generatizations had to be made. However, the preliminary results indicate that around 170 t CO2e are released annually as a consequence of our computer use, which equals the emissions released flying 33 times around the globe. The research also considered the carbon footprint of free-time internet use as well, in order to raise awareness among students and staff the emission associated with activities such as surfing the net or streaming HD videos.

The CF of the University of Oulu's food services in 2024 was calculated to be 1 151,51 tCO2e. Among the service providers, Uniresta accounted for 339,22 tCO2e, while Juvenes had a footprint of 812,29 tCO2e. The emissions of restaurant services has not returned back to the 2019 level, however the emissions have started to rise after the pandemic years.
In 2022 more extensive studies were conducted related to the university’s food services. More information can be found in the published report for the Carbon Footprint Working Group or the master's thesis about the topic.

The University of Oulu's Roadmap to Carbon Neutrality identifies measures and actions needed to achieve the target of reaching carbon neutrality by 2030.
The roadmap was created in three steps: First, the carbon neutrality targets of the service providers to the University of Oulu were assessed. Second, the measures and suggestions to reduce the carbon footprint and their impact were analysed. Third, the possibility of compensating and purchasing offsets to assure the target accomplishment were evaluated.
Proposed measures and action for reducing the University's carbon footprint include among others the procurement of carbon-neutral district heating, improving the efficiency of premises, introducing sustainable travelling guidelines and developing the restaurant services on campus. If only the service providers' carbon neutrality targets are taken into account, the carbon footprint of the University of Oulu will still amount to around 10 498 t CO2e in 2030. Based on the reduction potentials assumed in the roadmap, the University could lower its carbon footprint to 6 800 t CO2e by 2030.
The Carbon Neutrality Roadmap represents the first step towards achieving the University's goal. Now it is important that the various emission reduction strategies are put into action, and that the carbon footprint is being tracked annually. The roadmap sets high standards that will take a lot of effort to meet and should be handled in cooperation between staff members, students, faculties and other parties involved in providing service to the university. Building a culture of sustainability will require a continuous effort and the implementation of more innovative solutions as the measures presented in the roadmap are just the start.
Reports:
- Meeri Hilli (2025): The Carbon Footprint of the University of Oulu. Data collection 2024.
- Meeri Hilli (2024): The Carbon Footprint of the University of Oulu. Data collection 2023.
- Julia Kiehle and Meeri Hilli (2023): The Carbon Footprint of the University of Oulu. Data collection 2022.
- Aida Hosseinian (2022). Carbon Neutrality Roadmap. University of Oulu 2023-2030.
- Julia Kiehle and Meeri Hilli (2022): The Carbon Footprint of the University of Oulu. Data collection 2021.
- Rishikesh Raut (2022): Best practices for research laboratories to reduce their carbon footprint - Report to the Carbon Footprint Working Group of the University of Oulu.
- Julia Kiehle (2021): University of Oulu's commuting survey for staff members. Report.
- Rishikesh Raut (2021): Carbon Footprint of Research and Laboratory Equipment of the University of Oulu - Research report.
- Amin Javid (2021): Carbon Footprint of the ICT equipment and Internet use at the University of Oulu - Research report.
- Julia Kiehle and Meeri Hilli (2021): The Carbon Footprint of the University of Oulu in 2019 – Calculation report.
- Julia Kiehle and Meeri Hilli (2021): The Carbon Footprint of the University of Oulu. Data collection 2018–2020.
Diploma works:
- Dilshika Heenatigala Kankanamge (2023): Carbon footprint of food services at the University of Oulu.
- Rishikesh Raut (2022): Achieving carbon neutral research practices at the University of Oulu.
- Amin Javid (2022): The impact of multi-location work on reaching carbon neutrality objectives : the carbon footprint of ICT equipment use at the University of Oulu.
- Anna Kemppainen (2021): Oulun yliopiston tutkimustyön hiilikädenjälki: positiivisten ilmastovaikutusten mittari.
- Julia Kiehle (2021): Carbon neutral campus. Tools of carbon footprint and handprint assessment.
Journal articles:
- Julia Kiehle, Maria Kopsakangas-Savolainen, Meeri Hilli and Eva Pongrácz (2022). Carbon footprint at institutions of higher education: The case of the University of Oulu. Journal of Environmental Management, Volume 329, 2023. https://doi.org/10.1016/j.jenvman.2022.117056.